Visualising 802.11 Probe Requests - Part 2
Posted 4 years ago - 15 min read
Tags : Cyber SecurityNetworking
This post is part of a series and follows on from Part 1
Methodology
Data will be collected over a two-week period from public spaces in Birmingham during peak pedestrian hours. This data will be gathered using the Raspberry Pi packet sniffer built for the project. All data collected across this time frame will be cleaned and aggregated using a Pandas script for local storage in a MongoDB Database. A web portal will use this data to demonstrate patterns in the data along with the facility to geolocate devices previously visited networks using the WiGLE API.
Architectual Overview
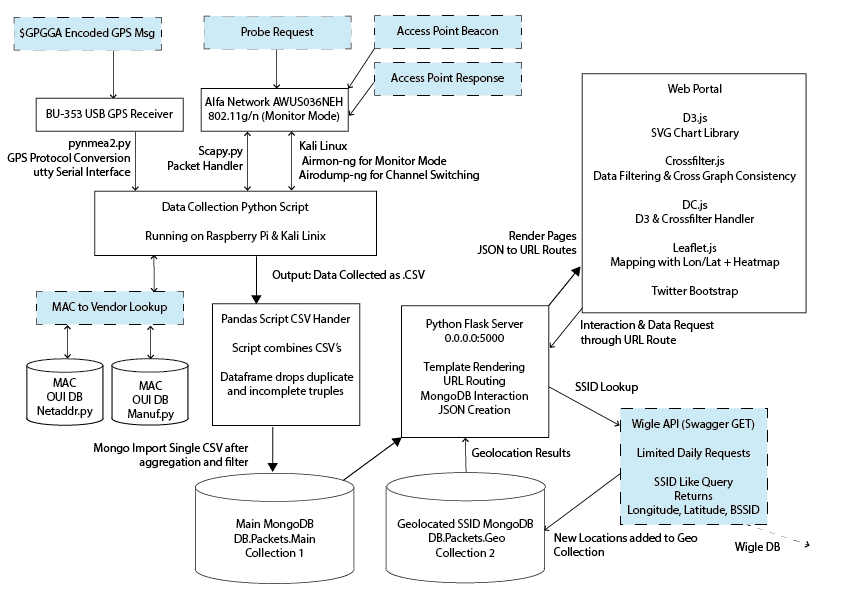
The three main phases of this project are data collection, data processing and data visualisation. These stages can be seen in this high-level graphical representation of the project. Fields represented in blue show external data sources which were aggregated.
Assumptions & Limitations
- The assumption that devices broadcasting on 5GHz have a second broadcast antenna for 2Ghz compatibility, therefore only scanning 2.4GHz frequencies should be enough for data collection.
- Once devices become associated with a network probe requests are stopped, I’m assuming most devices in public areas won’t be associated. This assumption excludes the university campus as most devices are already associated to the eduroam network.
- Limited by a single antenna rapidly channel switching. Packets will be lost while not on the correct receiving channel. As this happens quickly, and all channels are eventually used during probe requests, I’m assuming this will not impact the data collection significantly.
- The assumption that most devices won’t have their Wi-Fi hardware manually disabled in public spaces
WiFi Packet Collection Rig
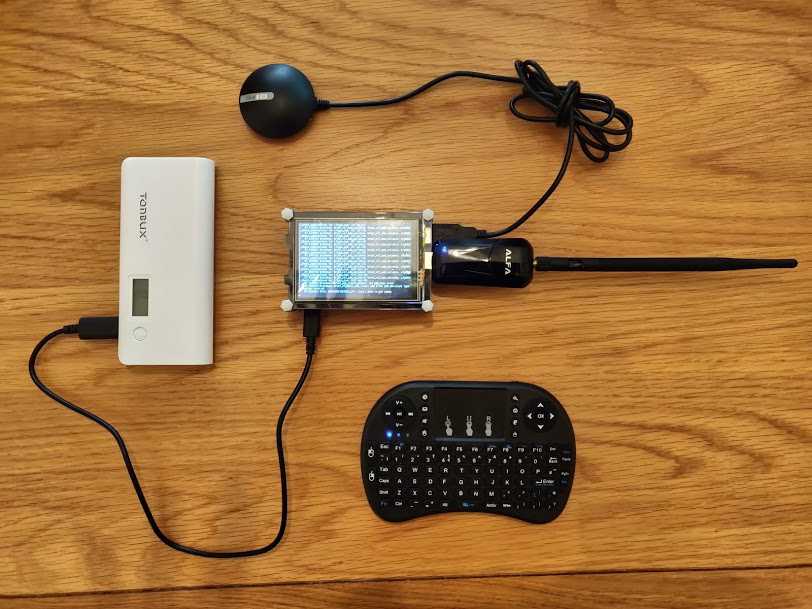
To gather the dataset for this project a packet sniffing device was built around a Raspberry Pi 3 B+. The Raspberry Pi ran Kali Linux (Re4son - Sticky Fingers Fork) used a monitor mode compatible Wi-Fi adapter, GPS puck and ran a Python script written to log network management packets in CSV format.
A rudimentary case was produced from a plastic container and zip ties to allow for transportation in a backpack during data collection. The device was powered using a high capacity power bank which allowed the device to run for around 4 hours, dependent on the levels of GPS & WI-Fi activity received.
Commands to start device:
Terminal window 1: airmon-ng start wlan0 followed by airodump-ng wlan0mon
Terminal window 2: python sniffGPS.py -m wlan0mon -f [output file name]
Technologies
Python Script - sniffGPS.py
Main packet collection script. Python was selected as the programming language for the packet sniffer due to the Scapy packet capture library and relative ease to learn a new and simple syntax for project.
Python Script - CSVHandler.py
Removes duplicate and incomplete tuples using Pandas from sniffGPS.py output CSV. Combines multiple output CSV files collected on different days into single CSV to be parsed to MongoDB via mongoImport command line interface.
Raspberry Pi with Kali Linux (Re4son - Sticky Fingers)
Gave access to preinstalled Aircrack-NG suite & TFT support with sticky fingers Kali image. Image intended for DIY drones. No need to SSH into device.
Python Library - Scapy
Scapy was used to parse packets from monitor mode enabled Wi-Fi adapter to python script
Python Library - pynmea2
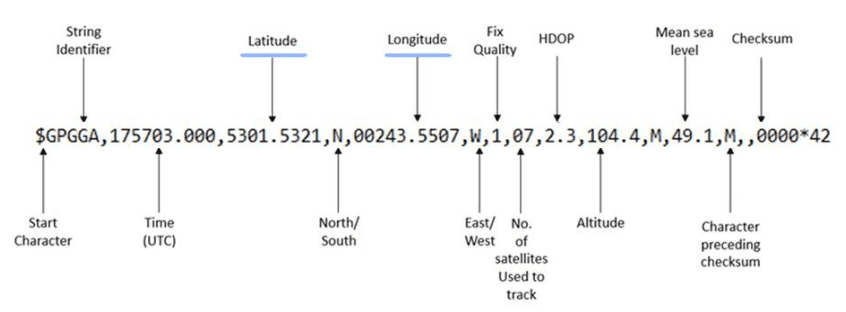
Converts \$GPGGA GPS message string to python object in which lat/long converted from Degrees, minutes, seconds (DMS) to decimal degrees (DD)
Python Library - netaddr
OUI database 1. Parse MAC to manufacturer. Roughly 70% complete database
Python Library - manuf
OUI database 2. Parse MAC to manufacturer. Later added to supplement netaddr. Gave more complete manufacturer representation in dataset. Less instances of unknown vendor. Continued using netaddr for manufacturer naming consistency
Hardware
ALFA AWUS036NEH 2.4GHz
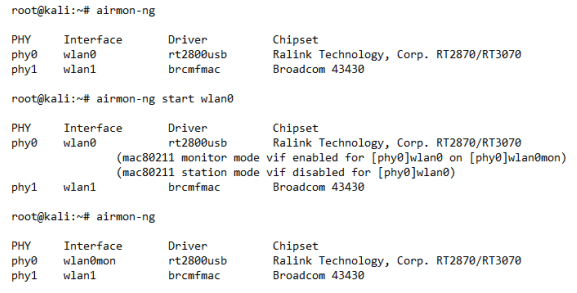
An Alfa Wi-Fi adapter was selected as it operated at 2.4GHz and can scan all b/g/n 802.11 standards. The adapter came equipped with a removable high gain aerial which claimed extreme range and used the Ralink RT3070 Chipset which was capable of being switched into monitor mode. Terminal commands demonstrating turning the chosen adapter from station mode into monitor mode using airmon-ng from the aircrack-NG suite can be seen here;
BU-353 USB GPS Receiver
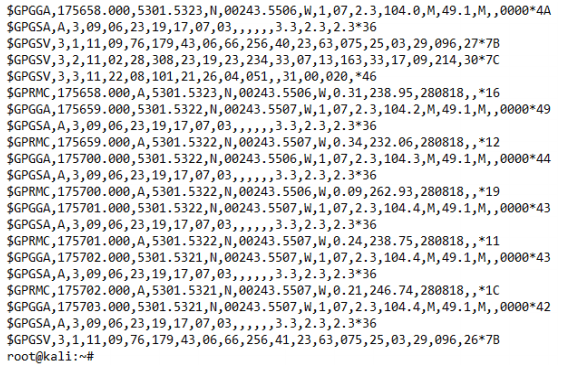
The BU-353 GPS receiver was selected due to its proposed compatibility with the GPSD library. While configuring the receiver, I found that only the older PS/2 models were compatible with this library. I, therefore, didn’t use GPSD and opted for a workaround, where incoming GPS messages from the receiver would be read through the Linux serial interface at dev/ttyUSB0. Examples of GPS incoming NMEA messages being read through the serial interface can be seen here;
\$GPGGA NMEA messages contain lon/lat coordinates in DMS format. These messages were converted to DD format using the pynmea2 library. This serial interface workaround did, however, bring bottlenecking issues during testing which I will outline later in the report.
Raspberry Pi 3 Model B+ with 3.5” TFT screen
The official Kali image for Raspberry Pi is extremely lightweight, and all unessential features have been removed to allow it to run on 8GB microSD cards. To enable me to drive a generic 3.5” TFT screen off the GPIO headers on the Pi I needed to use Re4sons - Sticky Fingers fork of Kali which had a TFT enabled kernel. This fork was developed for use in DIY Drone projects. In maintenance mode, I was able to install AdaFruit screen drivers which worked with the generic eBay 3.5” TFT; however, this removed the functionality of the HDMI interface on the Pi. I ran two SD card images throughout the project one for data collection with the TFT enabled Re4son fork and a second with stock Kali with HDMI for lab testing and writing the script.
Data Collection
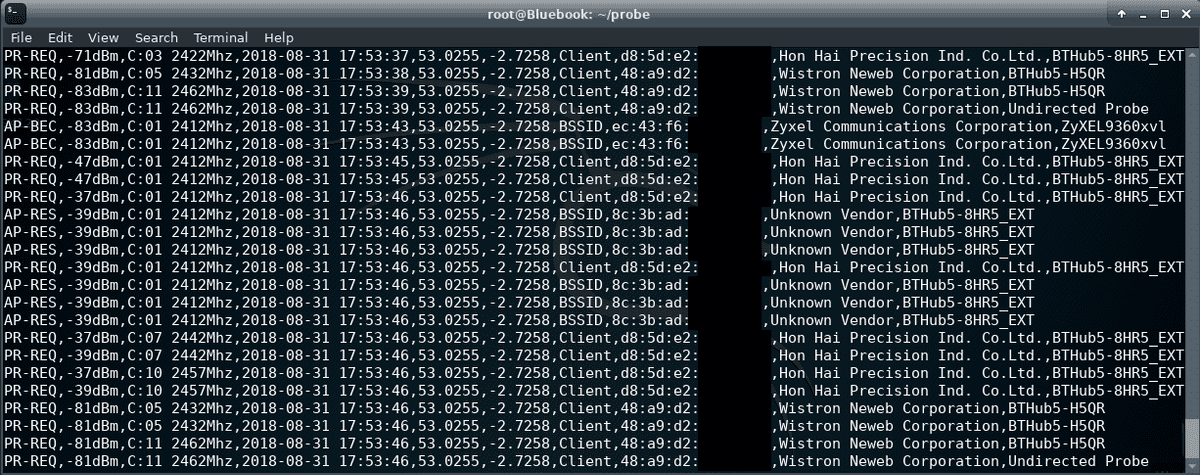
The packet collection script, exports data in comma separated value format (CSV) An incremental development approach lead of the collection script lead to various export formats being tested, examples are available in the projects code repository. The collection script logs packets indefinitely until execution is cancelled through the command line interface with Ctrl + C. While the script is running a rotating field, handler displays the output rows of the CSV on the Pi TFT screen, this can be seen below.
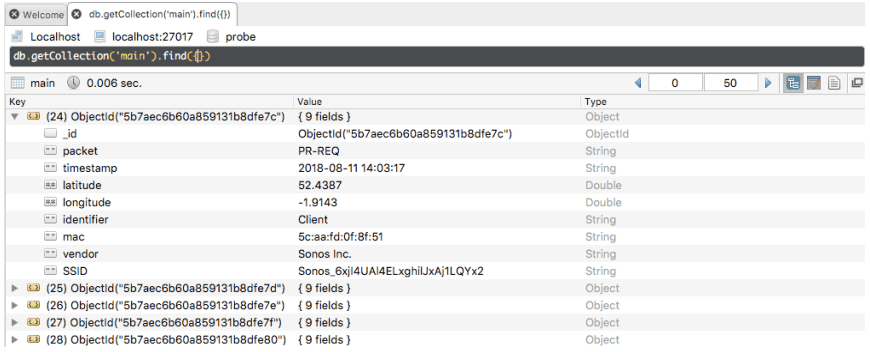
CSV was selected due to its viewing flexibility in excel and its capacity for direct upload to MongoDB through terminal interface ‘mongoImport’. The data schema is; 1. Management Packet Type 2. ISO Timestamp 3. Latitude 4. Longitude 5. Identifier (denotes if MAC is Client or BSSID) 6. MAC address 7. Manufacturer OUI Checked 8. Packet SSID (_id is a MongoDB reference key added at upload)
OUI Database Lookup
Two OUI lookup libraries were implemented. The first lookup netaddr appeared incomplete upon the first few data collection runs, as it gave many occurrences of Unknown Vendor in the data. The second library manuf was added which ran the second check if ‘unknown vendor’ was returned by netaddr. It was decided not to replace netaddr with the complete manuf library outright as it would have led to manufacturer naming inconsistencies in my dataset.
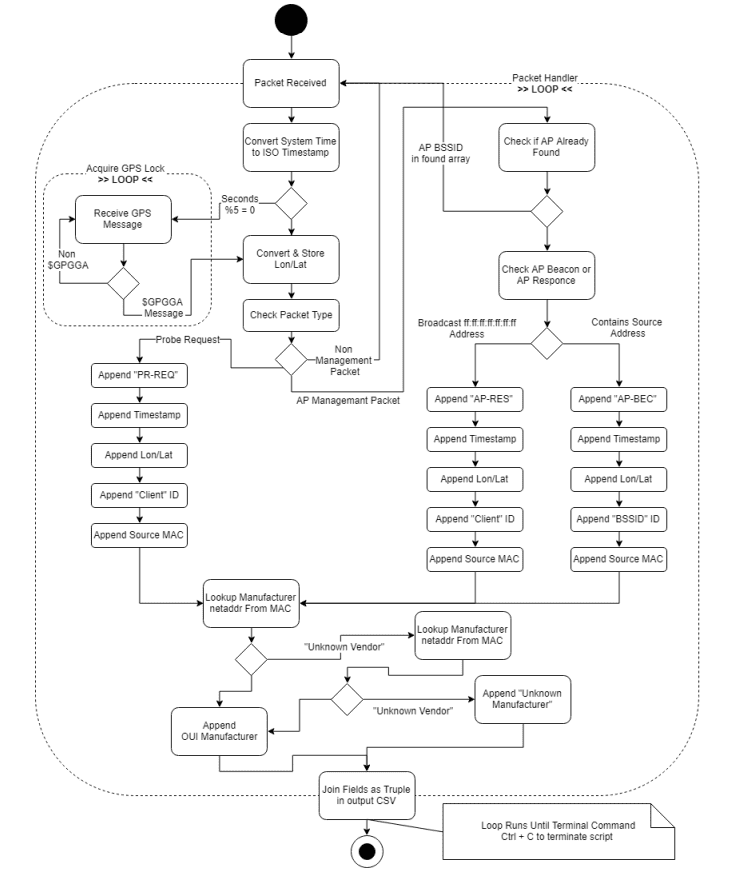
UML Activity Diagram (Probe Request Collection Script)
UML Activity Diagram - Packet Capture Script Running on the Raspberry Pi 3 B+
Controlled Conditions Testing
To ensure the packet sniffer was operating correctly testing was carried out under controlled conditions where an associated router was powered down and probe request were collected from a series of devices which I owned over 15 minutes.
Windows 10 Laptop (OS Build 17134)
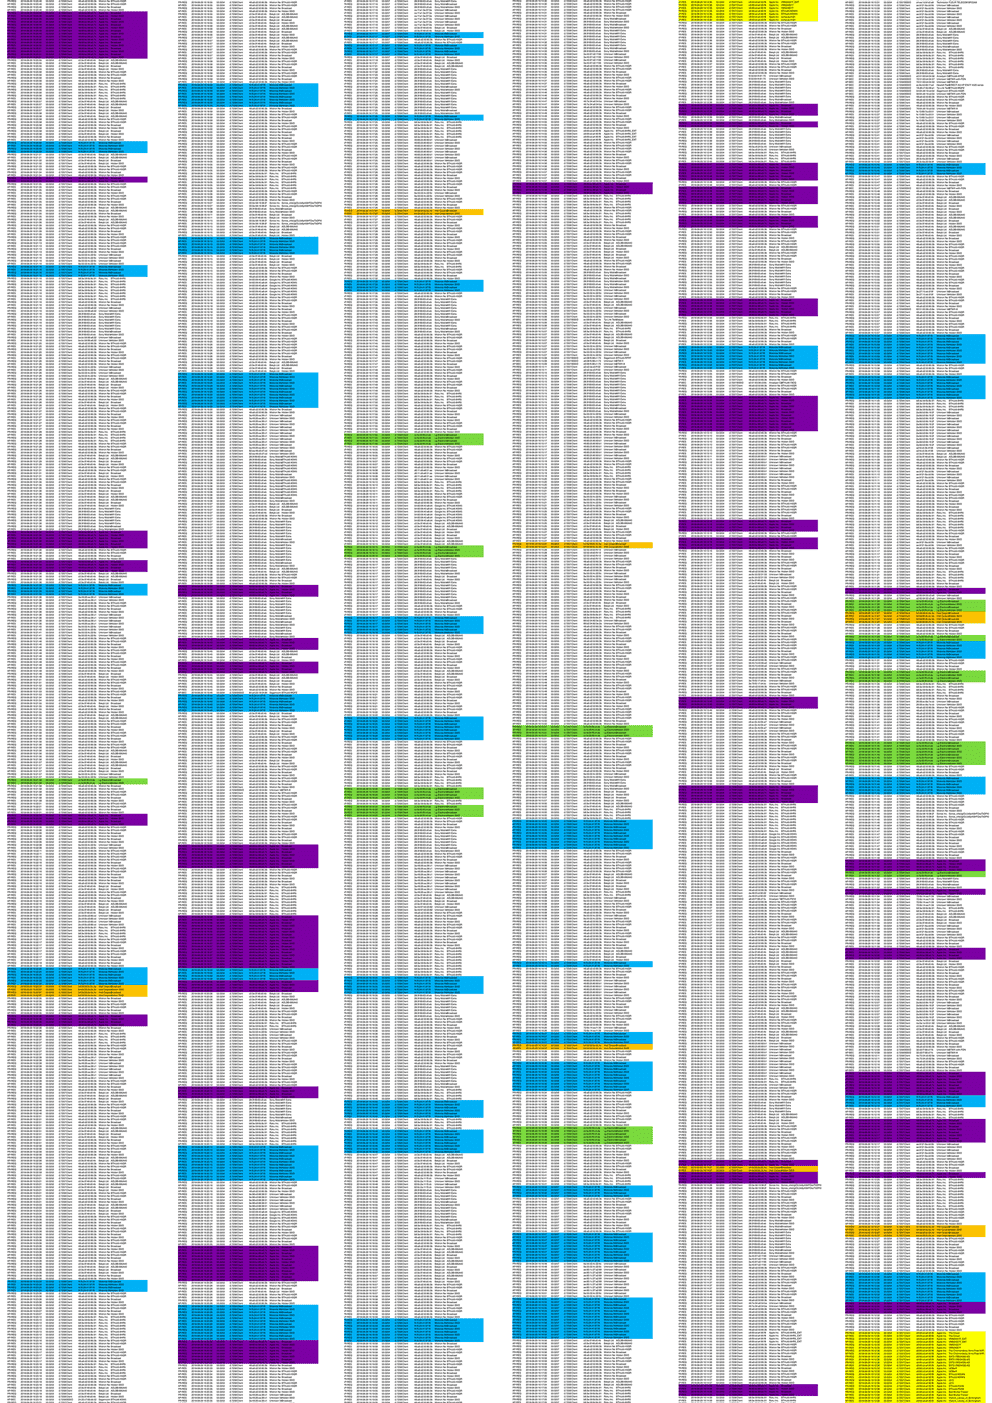
A windows laptop running the most up to date version of the OS with all current windows updates and security patches was monitored during testing. The laptop uses a dual band Intel Wi-Fi chipset. During the testing period the device was detected by its burnt in MAC address across 22 packets. 11 Undirected Probe Requests and 11 Probe Responses. The distribution of the gathered packets can be seen above in orange. As the BIA is visible, no MAC randomisation has been implemented.
MAC OS High Siera – (MBA Early 2015)
A MacBook Air notebook running the most up to date version of macOS High Sierra with all available updates and security patches was monitored during testing. This device uses an AirPort card developed by Apple for WLAN connectivity. During the testing period the device was detected by its burnt in MAC address across 44 packets. 32 Directed Probe Requests and 12 Probe Responses. The distribution of the gathered packets can be seen above in yellow. 16 associated networks were exposed. All the exposed SSIDs were given in a single probe burst and then subsequent probes exposed the last connected network. As the BIA is visible, no MAC randomisation has been implemented.
Android 6.0.1 – LG Nexus 5
A Motorola G4 Play running Android 7.1.1 (Nougat) with all security patches was monitored during testing. During the testing period the device was detected by its burnt in MAC address across 50 packets. 25 undirected probe requests and 25 Probe Responses. Packets distribution over the test period can be seen above in blue. As the BIA is visible, no MAC randomisation has been implemented.
Android 8.1.0 – OnePlus 6
A OnePlus 6 running Android 8.1.0 (Oreo) with all security patches was monitored during testing. During the testing period the device was not detected by its burnt in MAC address. Therefore, the device is likely using MAC randomisation. There were 50 instances of packets related to an unknown vendor in the data set. These could be randomised non OUI addresses related to this device, however they were all undirected and therefore don’t contain SSIDs that I could use to correlate to this device
Apple iOS 7 – iPhone 4
An Apple iPhone running iOS 7.1.2 with all security patches was monitored during testing. During the testing period the device was detected by its burnt in MAC address across 50 packets. 10 directed probe requests, 15 undirected probe requests and 25 Probe Responses. 3 SSIDs of previously joined networks were contained within the test data. Packets distribution over the test period can be seen above in purple. As the BIA is visible, no MAC randomisation has been implemented MAC randomisation was only implemented in iOS 8 and onwards.
The collection script developed for the project tested capable of detecting the closed set of devices through their MAC addresses and SSIDs contained within directed probe requests. As can be seen in the colour coded time series data each device due to different hardware and operating system transmitted a different pattern of network discovery packets with different densities and timings. It shouldn’t be overlooked that the MacBook Air only broadcast its discovery packets in two probe bursts over 15 mins and therefore would be easy to miss if the detector was on a different channel or I wasn’t in the area at the exact time of transmission. The windows laptop was similar in its lower frequency and density probe bursts. I believe that this is due to these devices not at the time of testing not being powered from the mains and in dropping into standby during the test. Laptops, unlike mobile devices, don’t require data connectivity for their fundamental operation unlike mobile devices roaming and this could be why there is a lower frequency of network discovery probes.
Field Testing & Calibration
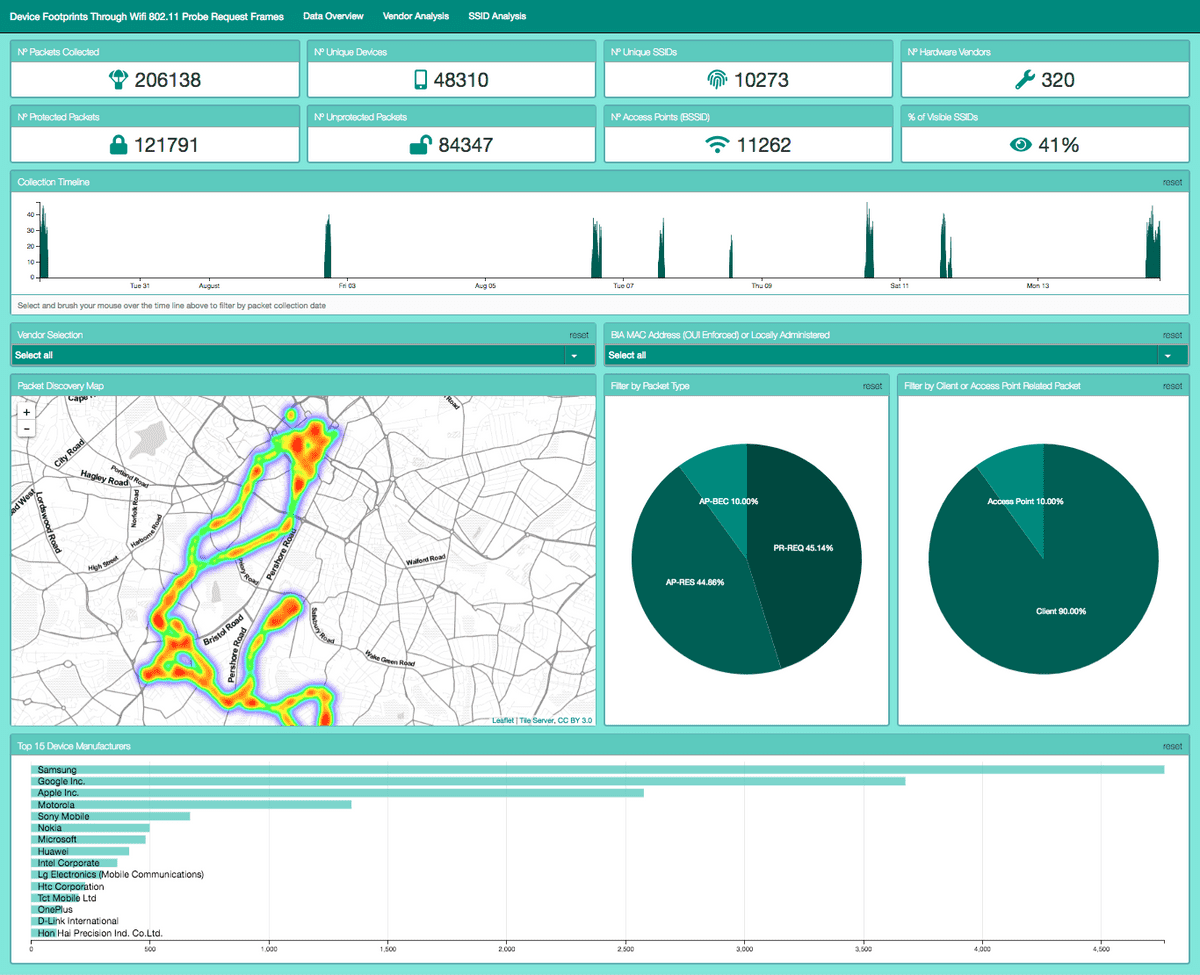
While running initial tests of the packet collection script I found the rate of packet collection was being throttled to around two packets per second as can be seen by the data collection timeline in the web GUI
As mentioned earlier this was due to using the serial interface for the GPS and attempting to affix live coordinates to each packet collected. This satellite message lookup at every packet meant that processing would be held and only written to the logger when a \$GPGGA GPS message was received through the serial input stream. These messages are sent around once every two seconds from satellites. To relieve this bottleneck, I decided to only check for a new GPS lock every 10 seconds. This workaround would slightly decrease the accuracy of the collection coordinates however as can be seen below this fix significantly increased the number of packets that script was able to process in the same timeframe.
Visualisation Portal
To visualise the data collected a web portal was built running on a Python Flask Server, drawing data as JSON from a MongoDB collection and rendering interactive graphical elements produced in JavaScript.
Technologies
Server: Flask Framework Server.py
Flask is a microframework for Python which allowed me to produce the server for this project in a single Python file without all the unnecessary bloat that would have been introduced with using a framework such as Django. Flask allowed me to configure my server to only include essential components, such as a HTML template renderer, JSON handler and local caching.
Vanilla Javascript Frontend
All interactive GUI functionality and graphical representations were produced in JavaScript. Allowed project to be ran in web browser
MongoDb
A locally hosted MongoDB database comprising of two collections was used for the project’s data repository. The ‘Main’ collection for collected packets & the ‘Geo’ collection for local storage of WiGLE API query results. MongoDB allowed queries from Flasks Pymongo library to be returned to the browser as JSON which was to be my input data format for the JavaScript code.
JavaScript Library: D3.js
Data Driven Documents (D3) Library used for rendering SVG & HTML elements. D3.js is a JavaScript library for dynamically representing data in HTML, SVG, and CSS. D3’s use of web standards allows modern browsers to show interactive and animated graphics without the need for a proprietary framework. I made use of ordinal bar charts, pie charts, number displays, box plots and bubble charts offered by the base D3 library.
JavaScript Library: Crossfilter.js
Crossfilter used to maintain consistency across data bins and graphical representations when filtering.
JavaScript Library: DC.js
DC acted as a handler between D3 and Crossfilter allowing for easier setup of graph elements and gave group and dimension flags to D3 setup.
JavaScript Library: Leaflet.js
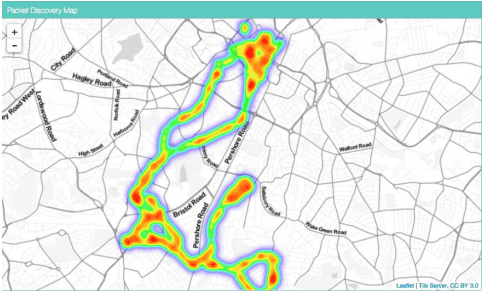
Leaflet.js allowed integration of customisable maps into the web portal. Maps used open source, stylised tile servers (stamen-toner-lite) and plotted GPS data represented with leaflets heat map overlay. The heatmap allowed for the better display of concentrations over points and rendered much faster than individual flags which was important as over 200,000 packets were being represented on the data overview page.
WiGLE API
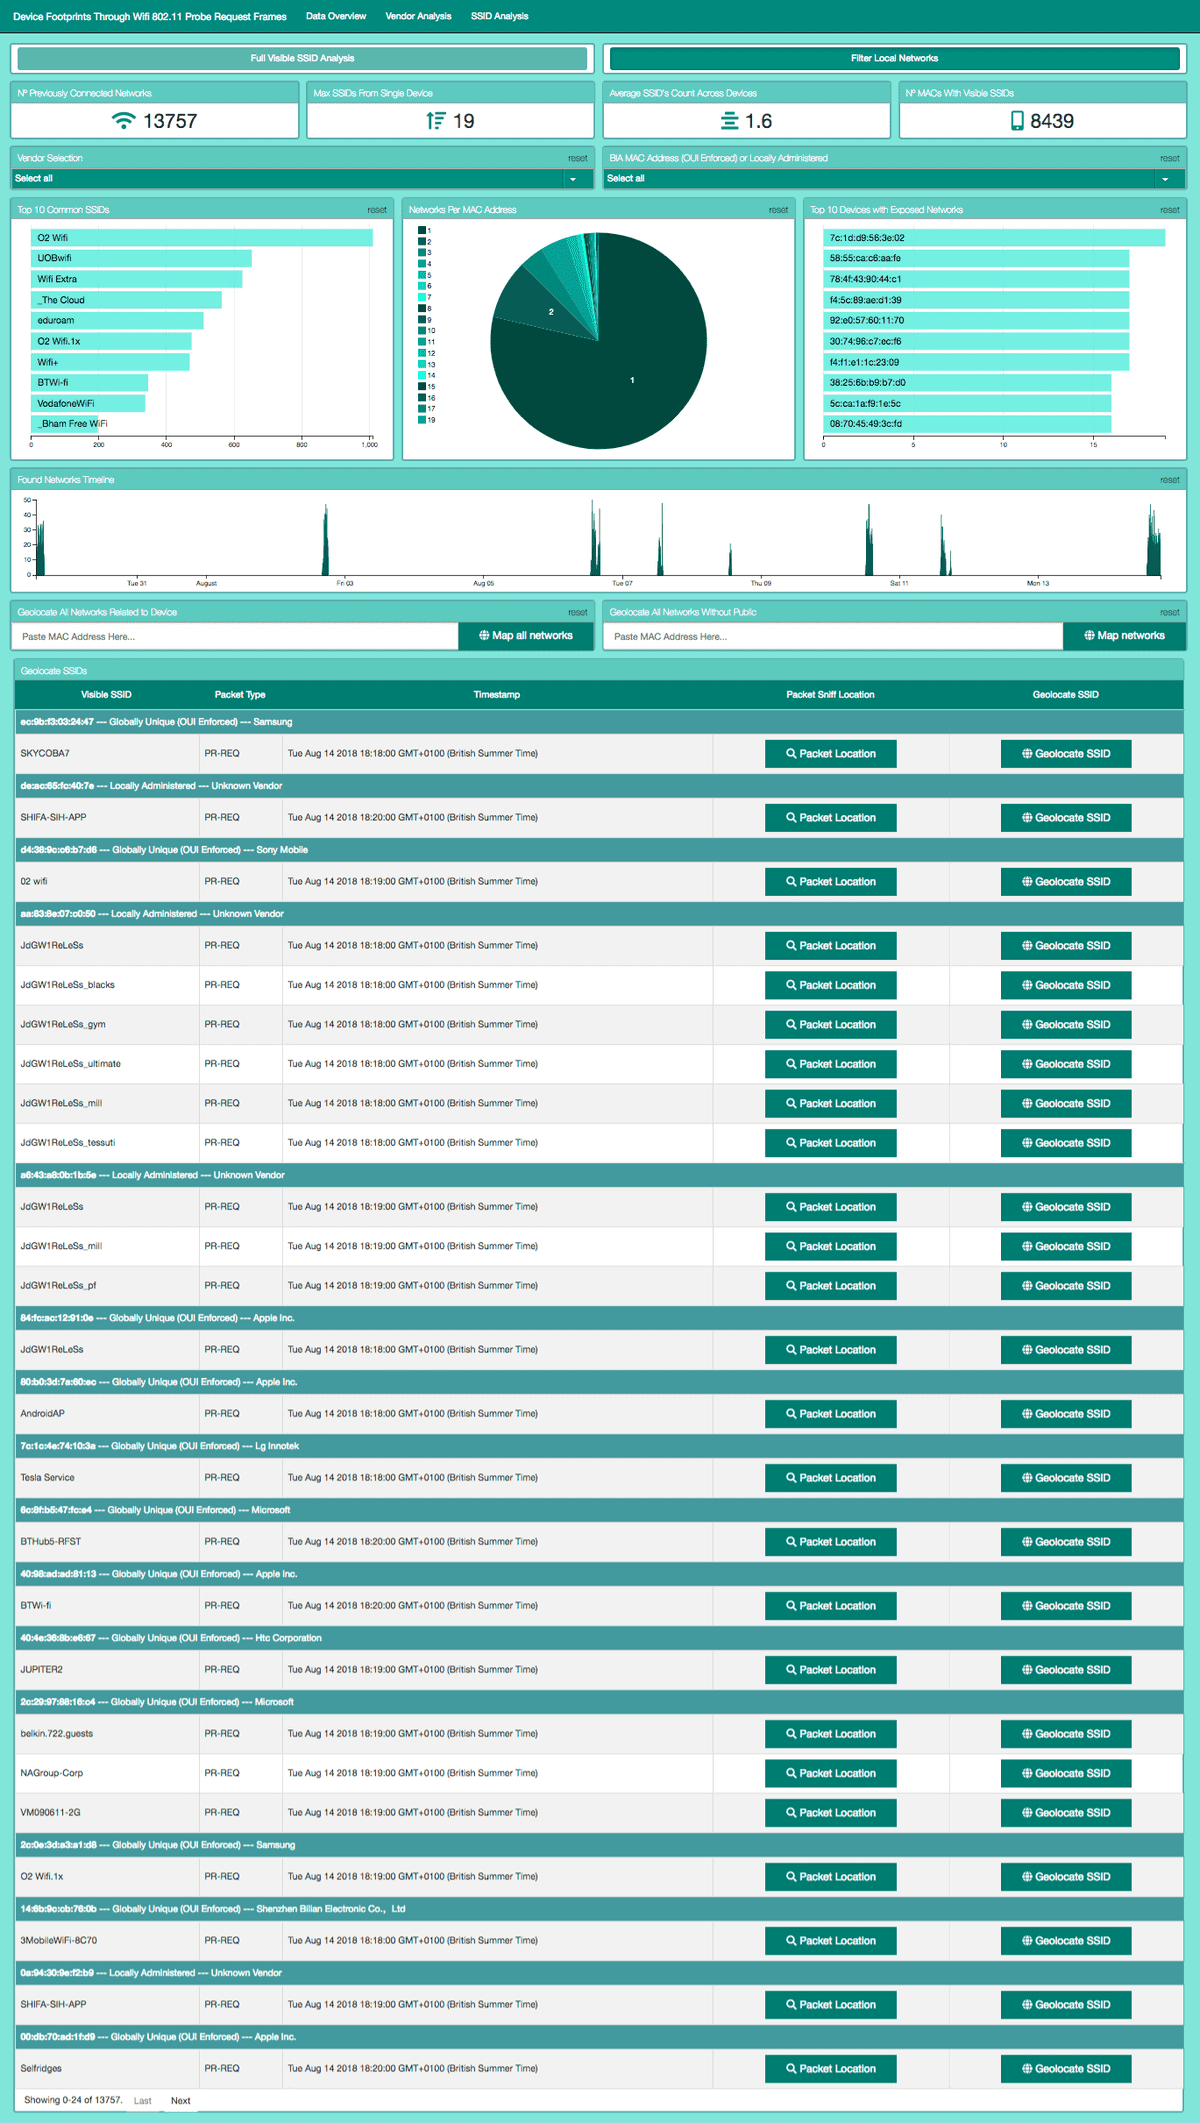
To generate potential network coordinates, based on the SSIDs queries need to be sent to the WiGLE wardriving database. Once an API header token was generated for WiGLEs Swagger API, queries were sent as HTTP GET requests and results returned as JSON. This return format allowed for easy integration with my JSON mapping tool leaflet. The API was configured using Pygle in the flask server code, and queries were triggered based on URL routing. A single request would be triggered if a single network was being located through a button press via the table on the SSID analysis page or a cascade of requests, for all SSIDs related to a device, when a geolocate by MAC address was requested by the user in the GUI.
Overcoming Limitations of the WiGLE API
The number of requests that can be handled by the WiGLE API is dependent on a user’s level of participation within the WiGLE community. As a new account was created for the project, there was a 100-request limit per day. There was also a limit of 100 on the number of results returned from a single query. The 100 requests per day were ample for developing the system however to overcome query result limitations I decided that it would be best to store all results returned from WiGLE in a MongoDB collection. Local storage resulted in a much more accurate representation of the locations of common public networks. Each time a request for a common SSID, for example, ‘McDonalds Free Wifi’ was made a full result set of 100 random matching networks would be returned and stored. Next time a query was executed a further 100 random matching networks would be returned. Saving results would quickly build up a database of network locations with the same name, accounting for result set overlap. When an SSID was to be geolocated a combination of stored results, and new WiGLE results form a more accurate and more densely populated heatmap. That would get denser over the more queries made until all networks have been stored offline.
